All Prediction Events
Aggregating data from Polymarket and Kalshi
Total Volume
$435.00M
Polymarket | $249.84M | |
Kalshi | $185.15M |
Total Markets
76,773
Polymarket | 39,621 | |
Kalshi | 37,152 |
Open Interest
$1.56B
5.18%Polymarket: $446.94M
0.99%Jun 5
Jun 6
Jun 7
Jun 8
Jun 9
Jun 10
Jun 11
Hot Markets
Volume 24h: $4M
Volume 24h: $4M

Volume 24h: $9M
Volume 24h: $7M
Volume 24h: $7M
Volume 24h: $5M
 Ending Soon
 All Crypto
 BTC Markets
- Ending SoonAll CryptoBTC Markets
| Market | Bid | Ask | Spread | Volume 24H | Liquidity | End Date | |
|---|---|---|---|---|---|---|---|
 Game 5: New York at San Antonio Winner? Kalshi Sports | $ 0.35 | $ 0.36 | 3% | $ 9.34M | N/A | Jun 28 2026 | |
Will Mexico win on 2026-06-11? Polymarket Sports | $ 0.999 | $ 1.00 | 0% | $ 9.07M | $ 1.20M | Jun 11 2026 | |
Will Czechia win the 2026 FIFA World Cup? Polymarket Sports | $ 0.001 | $ 0.002 | 100% | $ 7.83M | $ 11.40M | Jul 20 2026 | |
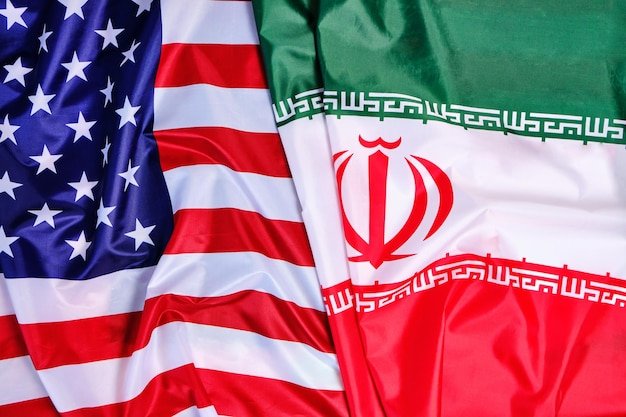
US x Iran permanent peace deal by June 15, 2026? Polymarket Politics | $ 0.129 | $ 0.139 | 8% | $ 7.30M | $ 528.81K | Jun 15 2026 | |
| $ 0.19 | $ 0.2 | 5% | $ 6.24M | N/A | Jun 29 2028 | ||
 Korea Republic vs Czechia Winner? Kalshi Sports | $ 0.37 | $ 0.38 | 3% | $ 5.67M | N/A | Jun 26 2026 | |
| $ 0.8 | $ 0.81 | 1% | $ 5.25M | N/A | Jun 29 2028 | ||
Will Norway win the 2026 FIFA World Cup? Polymarket Sports | $ 0.023 | $ 0.024 | 4% | $ 5.13M | $ 1.31M | Jul 20 2026 | |
Will Colombia win the 2026 FIFA World Cup? Polymarket Sports | $ 0.017 | $ 0.018 | 6% | $ 4.92M | $ 3.15M | Jul 20 2026 | |
Will Mexico win the 2026 FIFA World Cup? Polymarket Sports | $ 0.013 | $ 0.014 | 8% | $ 4.84M | $ 1.99M | Jul 20 2026 | |
Will Belgium win the 2026 FIFA World Cup? Polymarket Sports | $ 0.02 | $ 0.021 | 5% | $ 4.38M | $ 2.06M | Jul 20 2026 | |
 Will the Mexico win the 2026 Men's World Cup? Kalshi Sports | $ 0.021 | $ 0.025 | 19% | $ 3.72M | N/A | Jul 18 2028 | |
Will Netherlands win the 2026 FIFA World Cup? Polymarket Sports | $ 0.043 | $ 0.044 | 2% | $ 3.64M | $ 2.20M | Jul 20 2026 | |
Will Japan win the 2026 FIFA World Cup? Polymarket Sports | $ 0.017 | $ 0.018 | 6% | $ 3.55M | $ 1.84M | Jul 20 2026 | |
 Will Trump restart Project Freedom by June 30? Polymarket Politics | $ 0.999 | $ 1.00 | 0% | $ 3.54M | $ 1.87M | Jun 30 2026 | |
Will Ivory Coast win the 2026 FIFA World Cup? Polymarket Sports | $ 0.003 | $ 0.004 | 33% | $ 3.50M | $ 5.13M | Jul 20 2026 | |
Will South Korea win the 2026 FIFA World Cup? Polymarket Sports | $ 0.002 | $ 0.003 | 50% | $ 3.48M | $ 4.60M | Jul 20 2026 | |
Will Ecuador win the 2026 FIFA World Cup? Polymarket Sports | $ 0.008 | $ 0.009 | 13% | $ 3.48M | $ 3.57M | Jul 20 2026 | |
Will Morocco win the 2026 FIFA World Cup? Polymarket Sports | $ 0.015 | $ 0.016 | 7% | $ 3.41M | $ 1.09M | Jul 20 2026 | |
Will Portugal win the 2026 FIFA World Cup? Polymarket Sports | $ 0.108 | $ 0.109 | 1% | $ 3.35M | $ 1.85M | Jul 20 2026 |

1 - 20 from 81520
Show rows
20